The Question
California's statutory Fire Hazard Severity Zones (FHSZ) cover about 70% of San Diego County. Where they apply, are they capturing the right ground, and what, if anything, is happening on the 30% they don't cover? This project builds an independent, transparent susceptibility model from public data, checks it against the state's own product, and asks how both mid-century warming and a single well-documented fire (Valley Fire, 2020) stress-test the result.
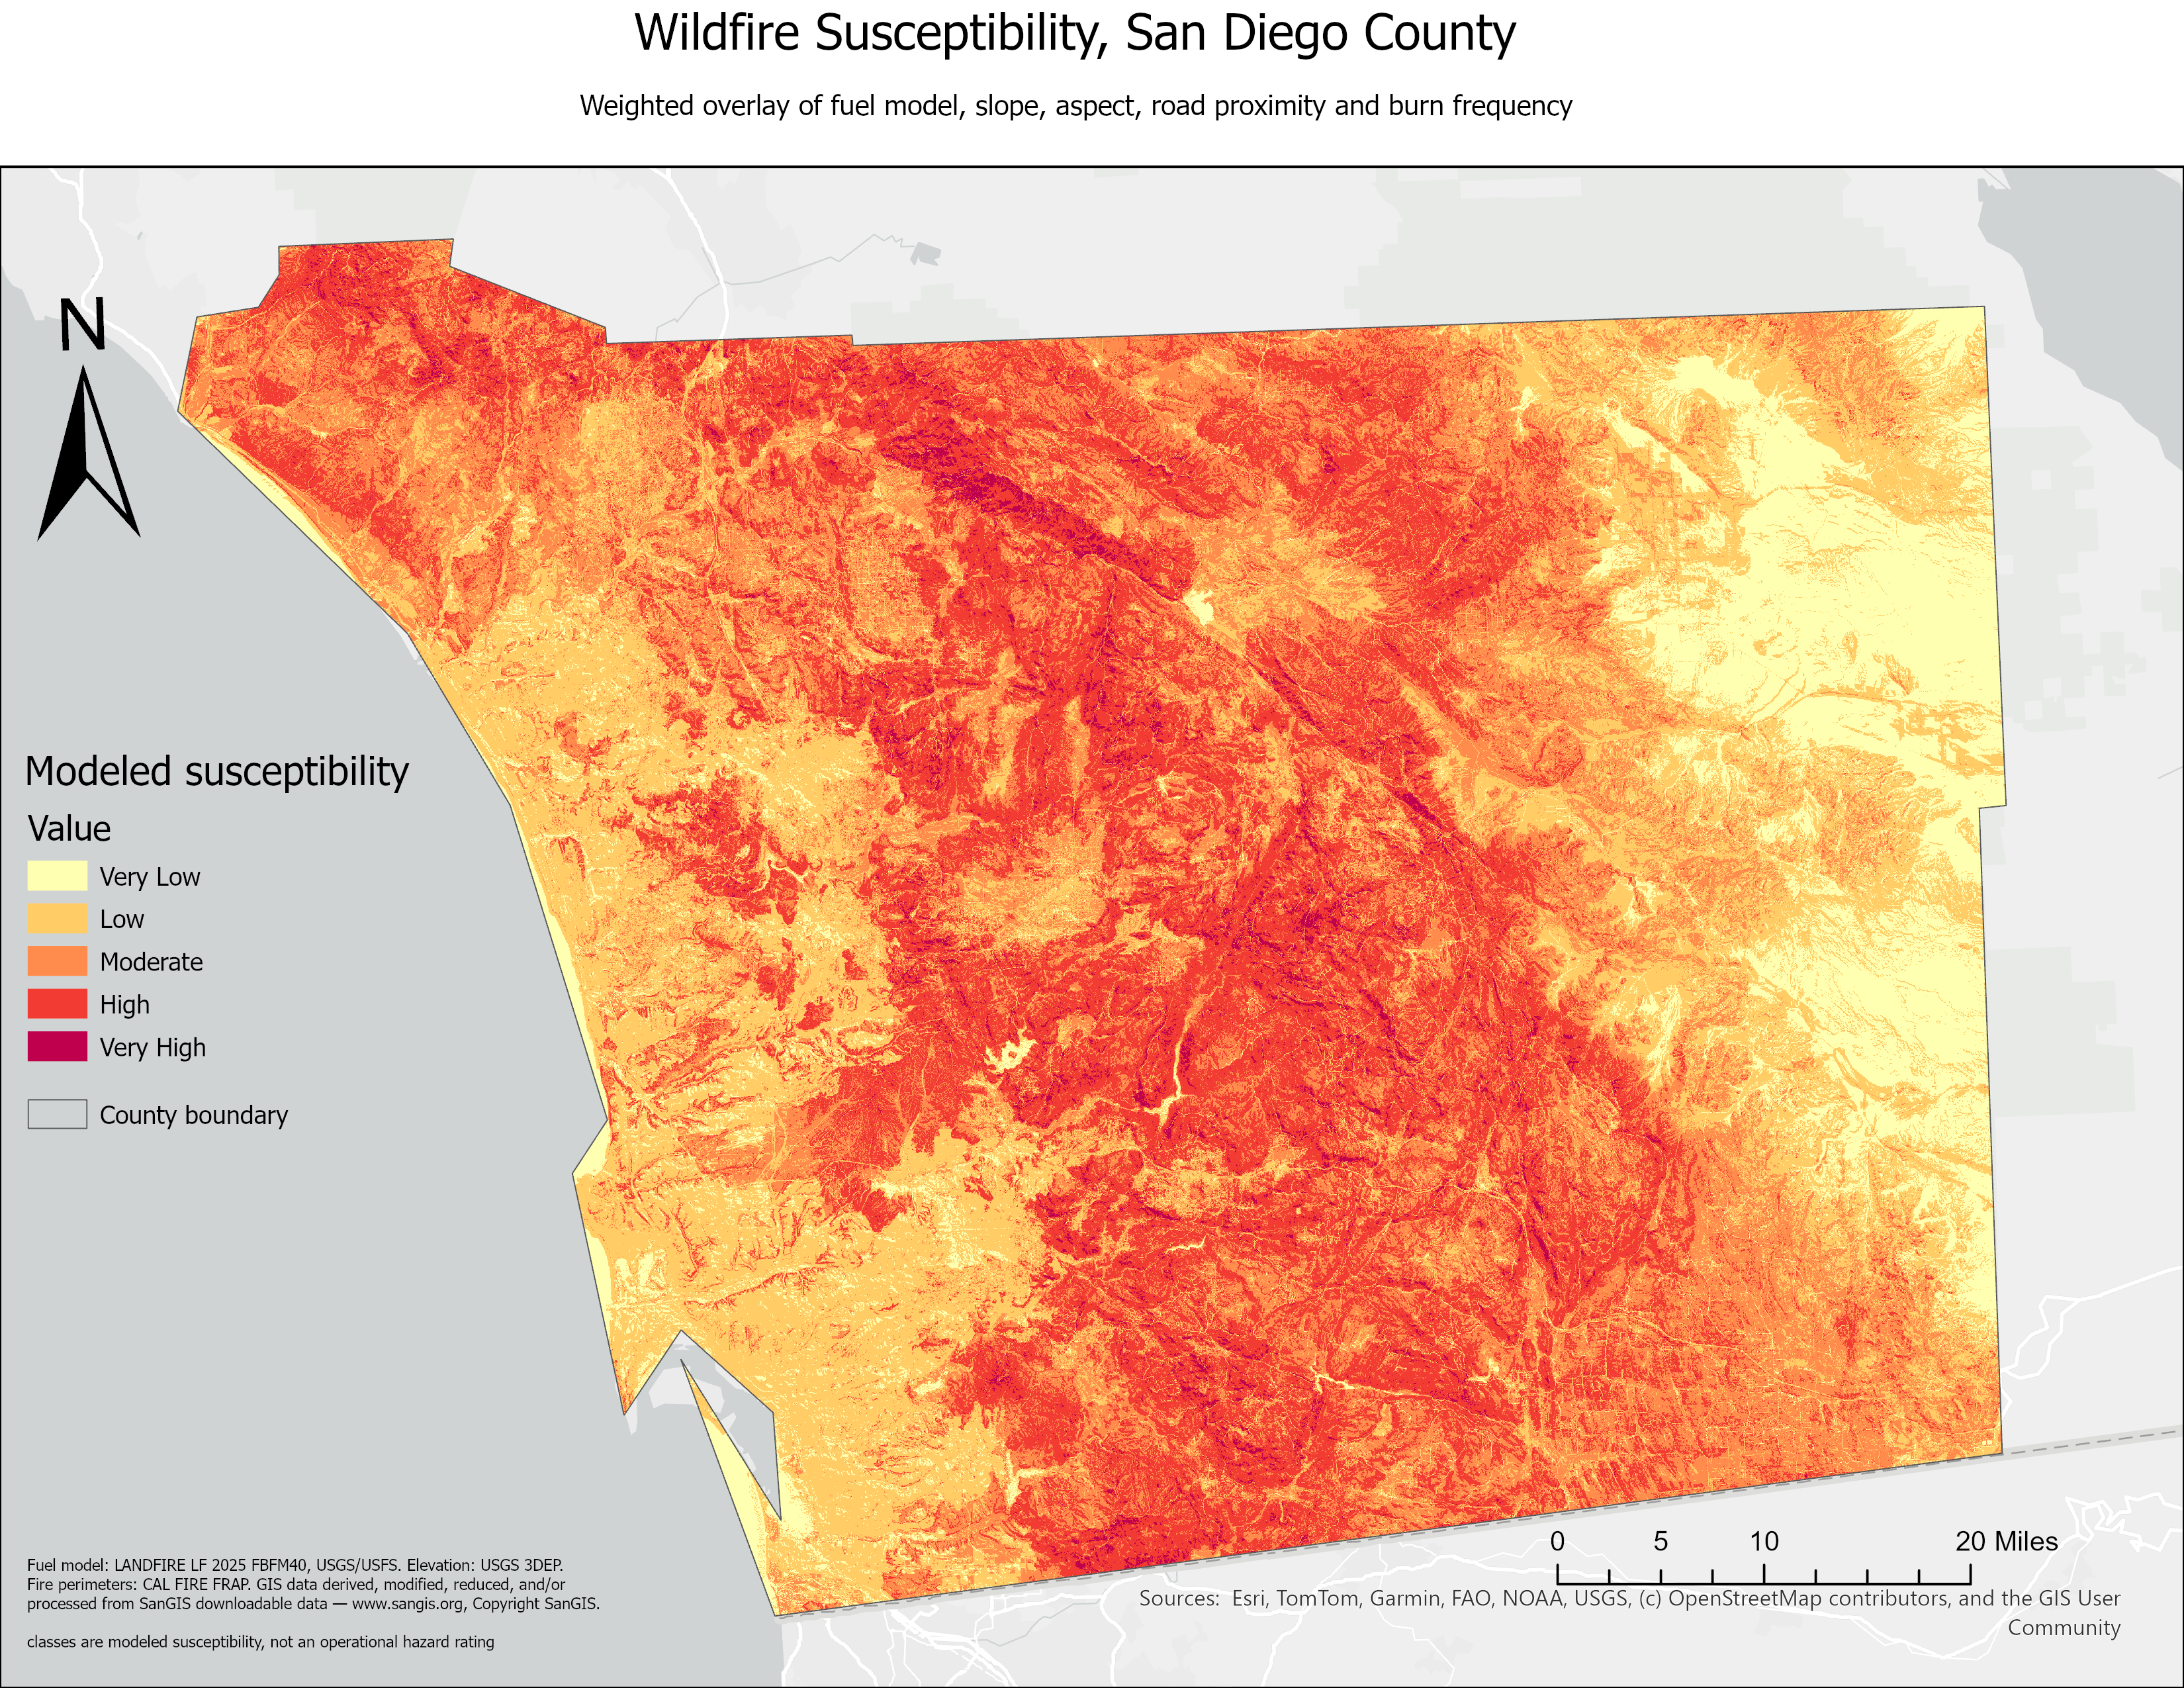
The headline result: 30.2% of the county (825,811 acres) scores High or Very High susceptibility. The full interactive application is published as an ArcGIS StoryMap: Read the interactive story →
Interactive Map
↑ Toggle layers in the top-right control: fire perimeters, community boundaries, ignition points, the road network, the Valley Fire burn extent, climate projection coverage, mid-century projected change, and the model's internal processing tiles. Hover any feature for details. See the Screenshots section below for the full classified susceptibility surface.
Data
| Source | Used for | Vintage |
|---|---|---|
| LANDFIRE 2025 FBFM40 (USGS/USFS) | Fuel model | 2025, current-state |
| USGS 3DEP | Elevation → slope, aspect | Service current |
| SanGIS | Road network (proxy for ignition access) | 2026-08-24 pull |
| CAL FIRE FRAP | Fire perimeters, 1950–2025 | Pinned pre-firep25_1 release |
| CAL FIRE FHSZ | Statutory hazard zones (validation target) | Adopted April 2025 |
| MTBS + Copernicus Sentinel-2 | Burn severity, Valley Fire 2020 | Extended vs. immediate assessment |
| Cal-Adapt (4-model GCM ensemble) | Mid-century climate modifier | 4th CA Climate Change Assessment, CMIP5 |
| SANDAG Subregional Areas | 41 community boundaries | 2020 cycle |
Method
Five input layers were reclassified to a common 1–5 scale and combined using a weighted sum (not ArcGIS's Weighted Overlay tool, which rounds to integers and mean-reverted the first attempt into a surface with zero Very High cells).
- Fuel model (35%): the necessary condition for fire, and the best-sourced input.
- Slope (25%): Rothermel's slope factor scales with the square of slope, a published functional form.
- Distance to road (15%): ~95% of California ignitions are human-caused, so proximity proxies for where people ignite.
- Aspect (15%): solar loading acts indirectly, through fuel moisture.
- Burn frequency (10%): lowest weight, because LANDFIRE already partly encodes recent burns as changed fuel.
The model was validated against FHSZ using conditional distributions, not a single agreement statistic. Mean modeled susceptibility by FHSZ class is monotonic: Moderate 2.02 → High 2.62 → Very High 3.14. Climate was applied as a bounded modifier using a Cal-Adapt 4-model GCM ensemble (RCP 8.5 primary, RCP 4.5 comparison; 2035–2064 vs. 1985–2014), adjusting the existing 30 m surface rather than replacing it.
Findings
The Historical Record (1950–2025)
Since 1950, 46% of the county (1,247,928 acres) has burned at least once, not 72%, which is what naive summation of overlapping fire perimeters gives (reburn inflation factor: 1.66×). More fires does not mean more fire: the 1980s had the most ignitions of any decade (251) but burned only 7.8% of the total area, while the 2000s had 43% fewer fires and burned 41.8%. Mean fire size has collapsed: 6,112 acres in the 2000s, 840 in the 2010s (a 7× drop), 427 so far in the 2020s, while the 2020s simultaneously carry the second-highest ignition rate on record. Five years carry 54% of everything burned since 1950.
The Susceptibility Surface
30.2% of the county scores High or Very High combined (825,811 acres). The Very High class alone is 49,632 acres, roughly three times the size of the 2020 Valley Fire.
| Class | Share | Acres |
|---|---|---|
| Very Low | 11.4% | 311,927 |
| Low | 28.1% | 767,801 |
| Moderate | 30.2% | 826,060 |
| High | 28.4% | 776,179 |
| Very High | 1.8% | 49,632 |
Where this model and FHSZ can be compared, they agree strikingly at the top of the scale: 99.6% of modeled Very High sits inside FHSZ Very High, and 94.3% of modeled High does too. But 398,874 acres of modeled High-or-Very-High land sit on ground the state's hazard maps do not classify at all: Federal Responsibility Area (Cleveland National Forest, Camp Pendleton, BLM parcels, tribal trust land) that FHSZ isn't built to cover. Only 45.2% of modeled Very High falls inside an FHSZ polygon at all.
One Fire, Up Close: the Valley Fire, September 2020
The registered prediction was half right, and the half that failed is the more useful half. The immediate post-fire assessment read systematically higher than MTBS's extended assessment: mean dNBR 0.431 vs. 0.235, a difference of +0.196, higher in 95.6% of 73,667 co-registered cells, with spatial patterns correlating at 0.79. But the divergence was not concentrated in resprouting shrubland as predicted; the gap varies by only about 0.01 across fuel families covering 91% of the burn. The higher immediate reading is real; why it's uniform rather than concentrated is left open rather than guessed.
A Warming County, Unevenly
Mid-century hazard moves inland and upslope. Nine of 41 communities show higher susceptibility by 2035–2064 under RCP 8.5, every one inland or backcountry, and six already sit in the county's seven most hazardous places today. Countywide, modeled area burned rises 3.53% under RCP 8.5 and 0.60% under RCP 4.5. The four climate models agree on the direction of change in only 44.0% of cells, and 10.2% of the county (279,725 acres) has no projection at all, left blank rather than interpolated across.
Screenshots
Limitations
- No weather. No wind, humidity, or fuel moisture. Santa Ana winds are the single largest driver of catastrophic fire here, and this is a susceptibility surface, not a fire-behavior simulation.
- No suppression access. The model scores "close to road" as high because that's where people start fires; it can't represent the opposite effect where remote terrain lets a fire grow longer before response.
- Ignition is a proxy, not a measurement. Road proximity stands in for human ignition; a direct ignition-density layer would be a better input.
- Road distances are biased near the county line: the network stops at the boundary, understating susceptibility for cells nearby.
- Resolution mismatch. A 30-meter hazard surface combined with a 6-kilometer climate signal can't discriminate between neighboring communities sharing a climate cell.
- The climate product is CMIP5-vintage (RCP scenarios), while current literature has largely moved to CMIP6/SSP.
What I'd Do Next
- Attribution analysis to separate the three candidate explanations for the post-2008 decline in burned area: suppression capacity, fuel exhaustion from the 2003/2007 megafires, or a small-N run of quiet years.
- Swap the ignition proxy. A kernel-density ignition layer already exists for the historical analysis; feeding it in directly would remove the proxy's most obvious blind spot.
- Add a suppression-access layer (travel time from the nearest fire station) to offset the model's one-directional treatment of road proximity.
- Move to a CMIP6/SSP climate product once one exists at comparable resolution.
- Extend the road network across the county line to remove the boundary-adjacent understatement.