Overview
SNAP (formerly Food Stamps) is a critical lifeline for households struggling to cover grocery costs. Economic downturns hit certain communities harder — and those same communities tend to recover more slowly. This project assessed demographics vulnerable to food insecurity using SNAP Quality Control data from the USDA, conducting a 10-year gap analysis comparing 2007 and 2017 datasets to examine lasting impacts on vulnerable communities.
Using an ArcGIS spatial analysis MOOC, two contrasting counties were identified as study areas: San Juan County, New Mexico (an emerging hot spot) and Cherry County, Nebraska (an emerging cold spot). The target variable was CAT_ELIG — whether a household was eligible (1) or not eligible (0) for SNAP benefits.
Methodology
Each dataset started with 400,000+ records and 800 features. Through nullity assessment, correlation analysis, and domain knowledge, the data was reduced to 32 features and ~4,000 final records.
- Downloaded SNAP Quality Control data from the USDA for 2007 and 2017
- Removed columns with all null values, then dropped columns with more than 50% nulls
- Imputed remaining nulls with the mean using sklearn SimpleImputer
- Used correlation analysis on 2007 data to select top 5 features per section — 32 final features
- Extracted and compared county-level data for San Juan County, NM and Cherry County, NE
- Built a Vote Ensemble model combining Random Forest, Gradient Boost, and Bagging Classifier
- Achieved a 95% cross-validation score on the final model
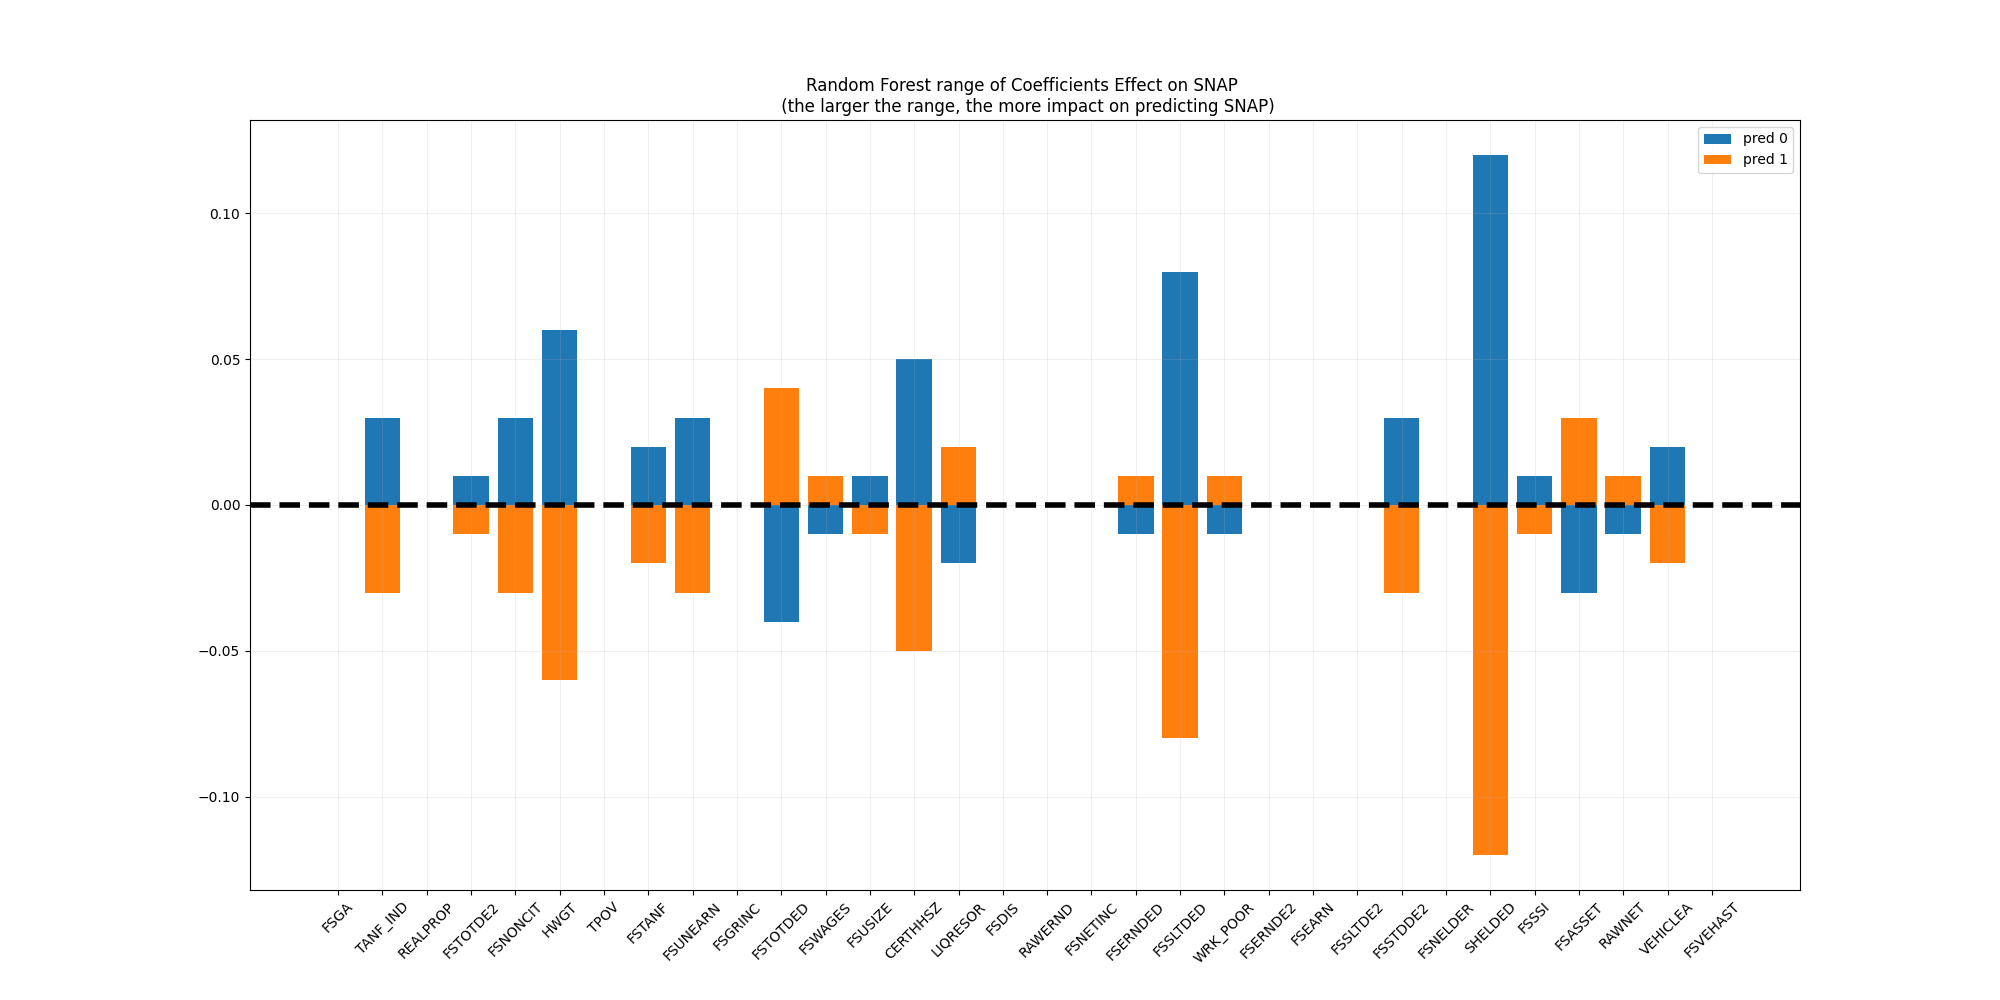
- Visualized feature importances and state-level predictions using Matplotlib and Seaborn
Key Findings
Several patterns emerged from the analysis:
- SNAP requesters typically had small households — one to two children maximum
- Approximately 50% were single mothers heading households
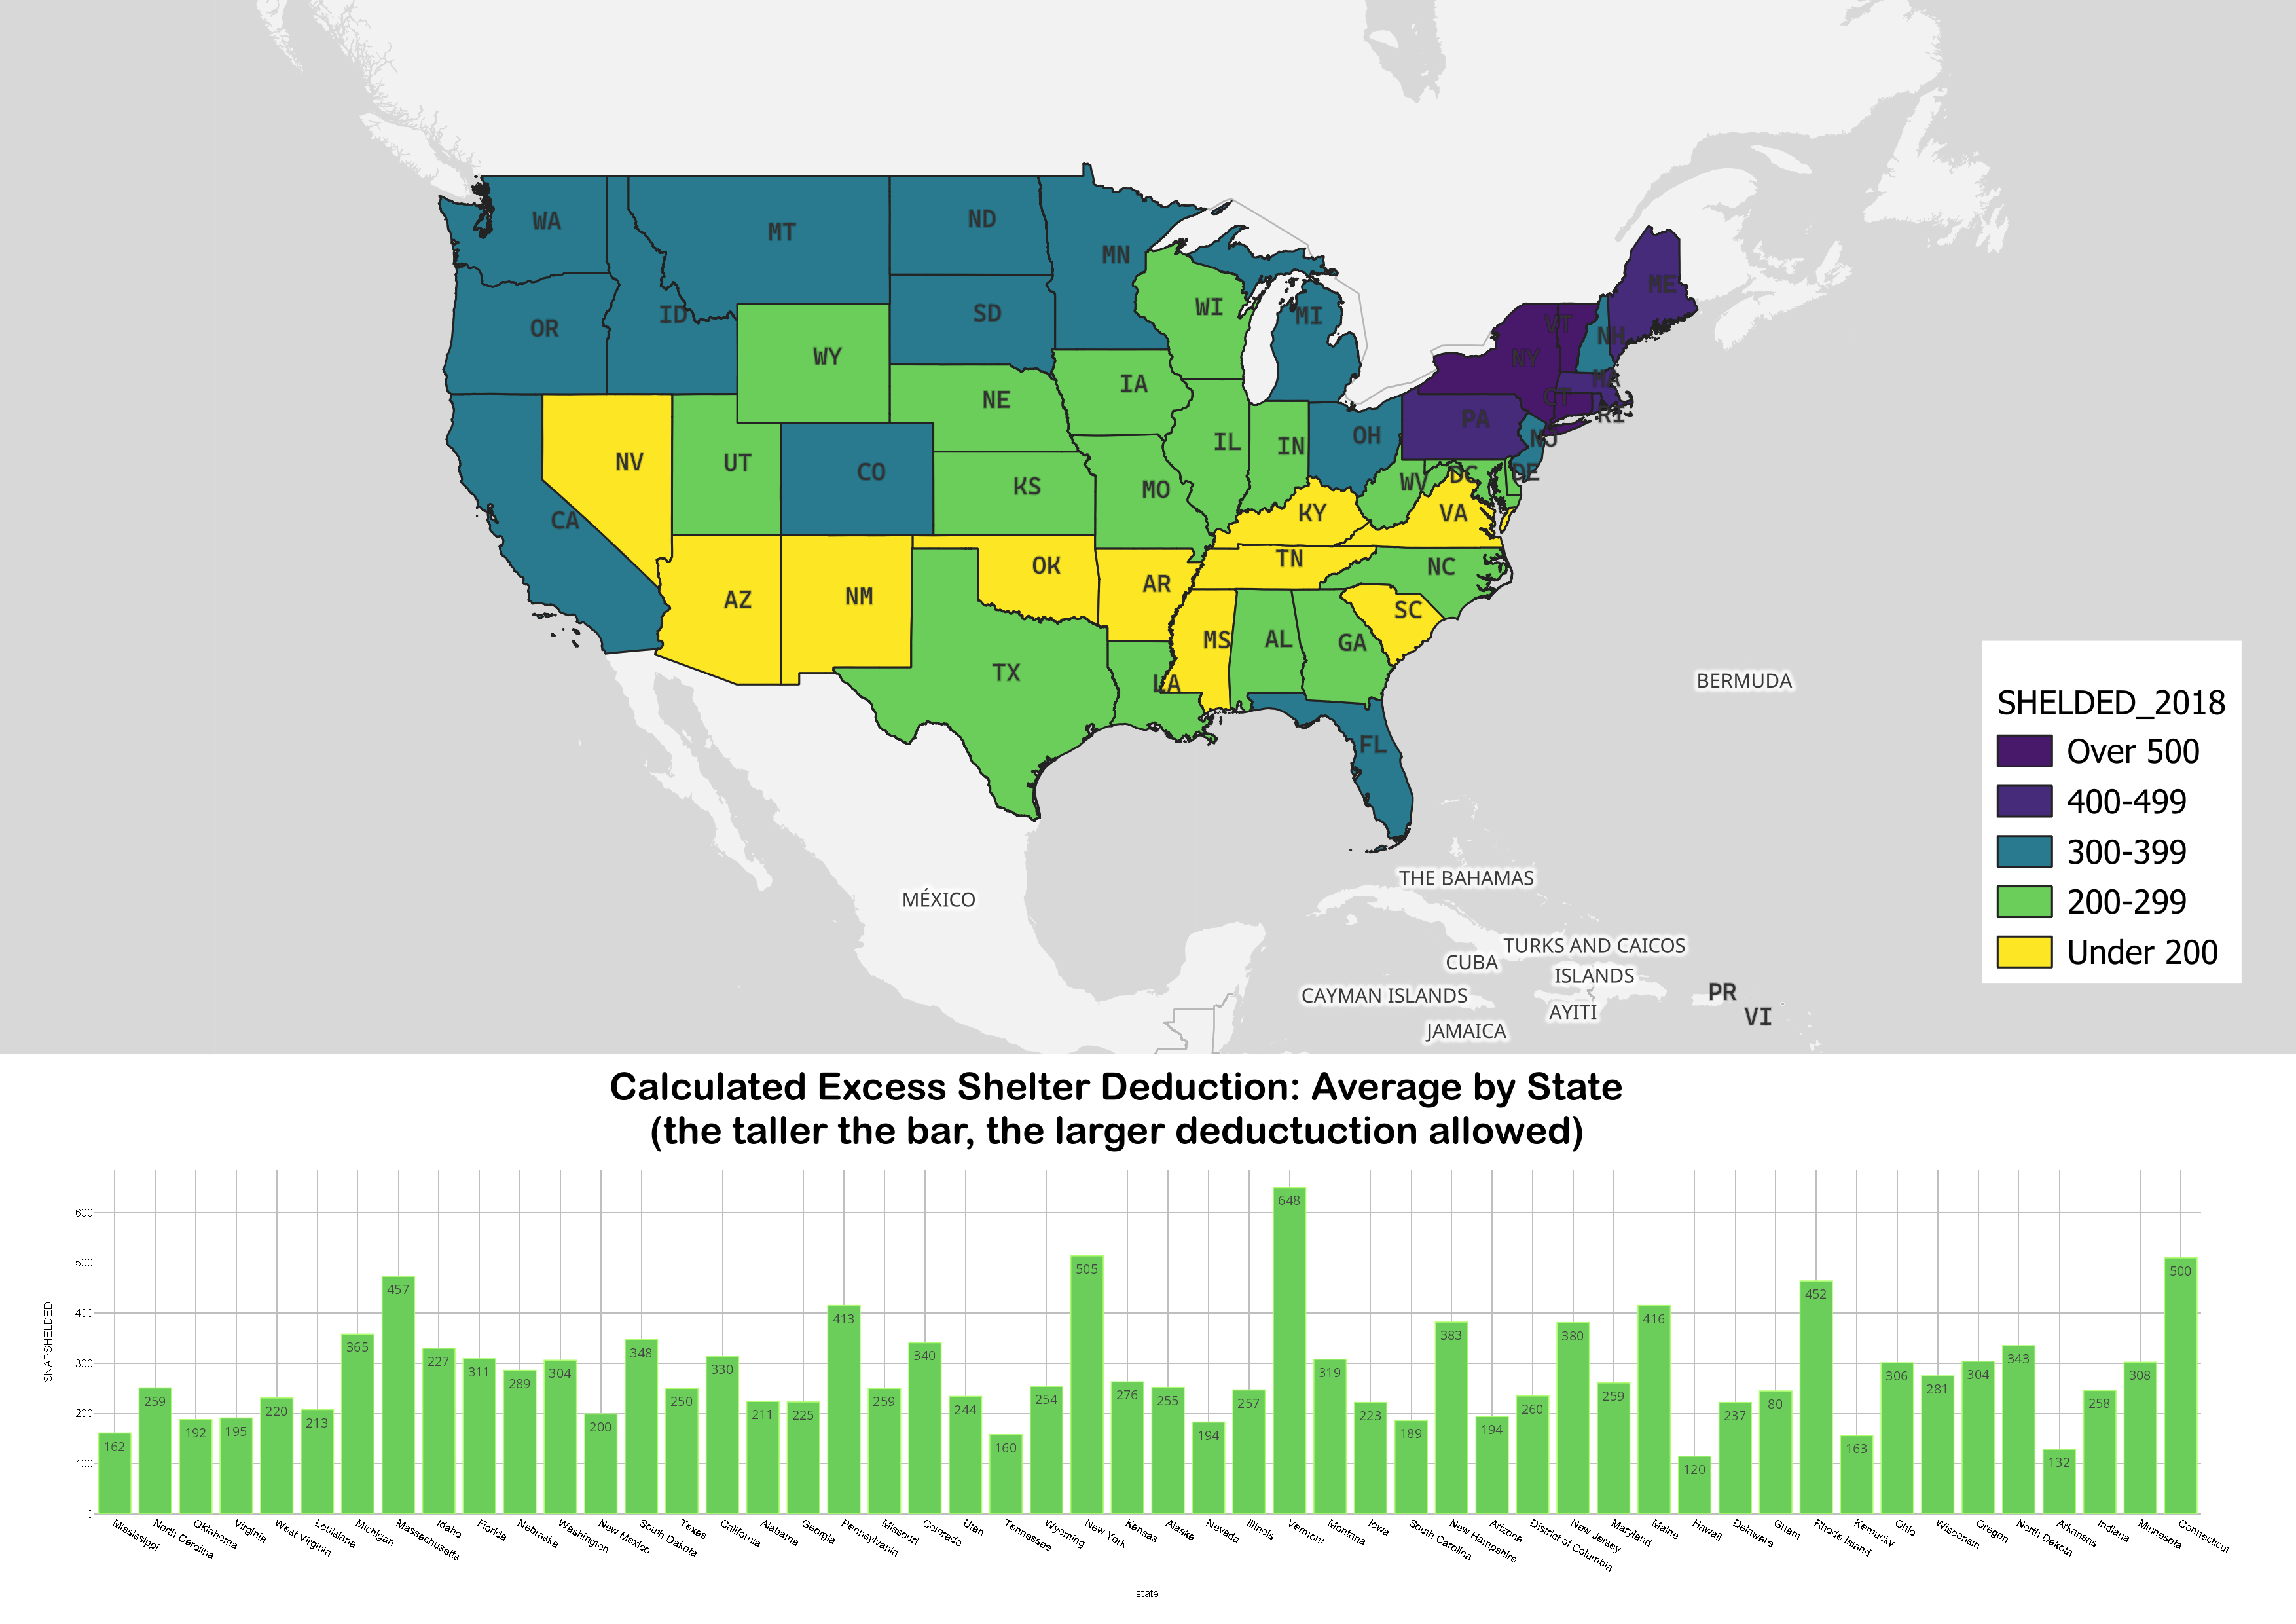
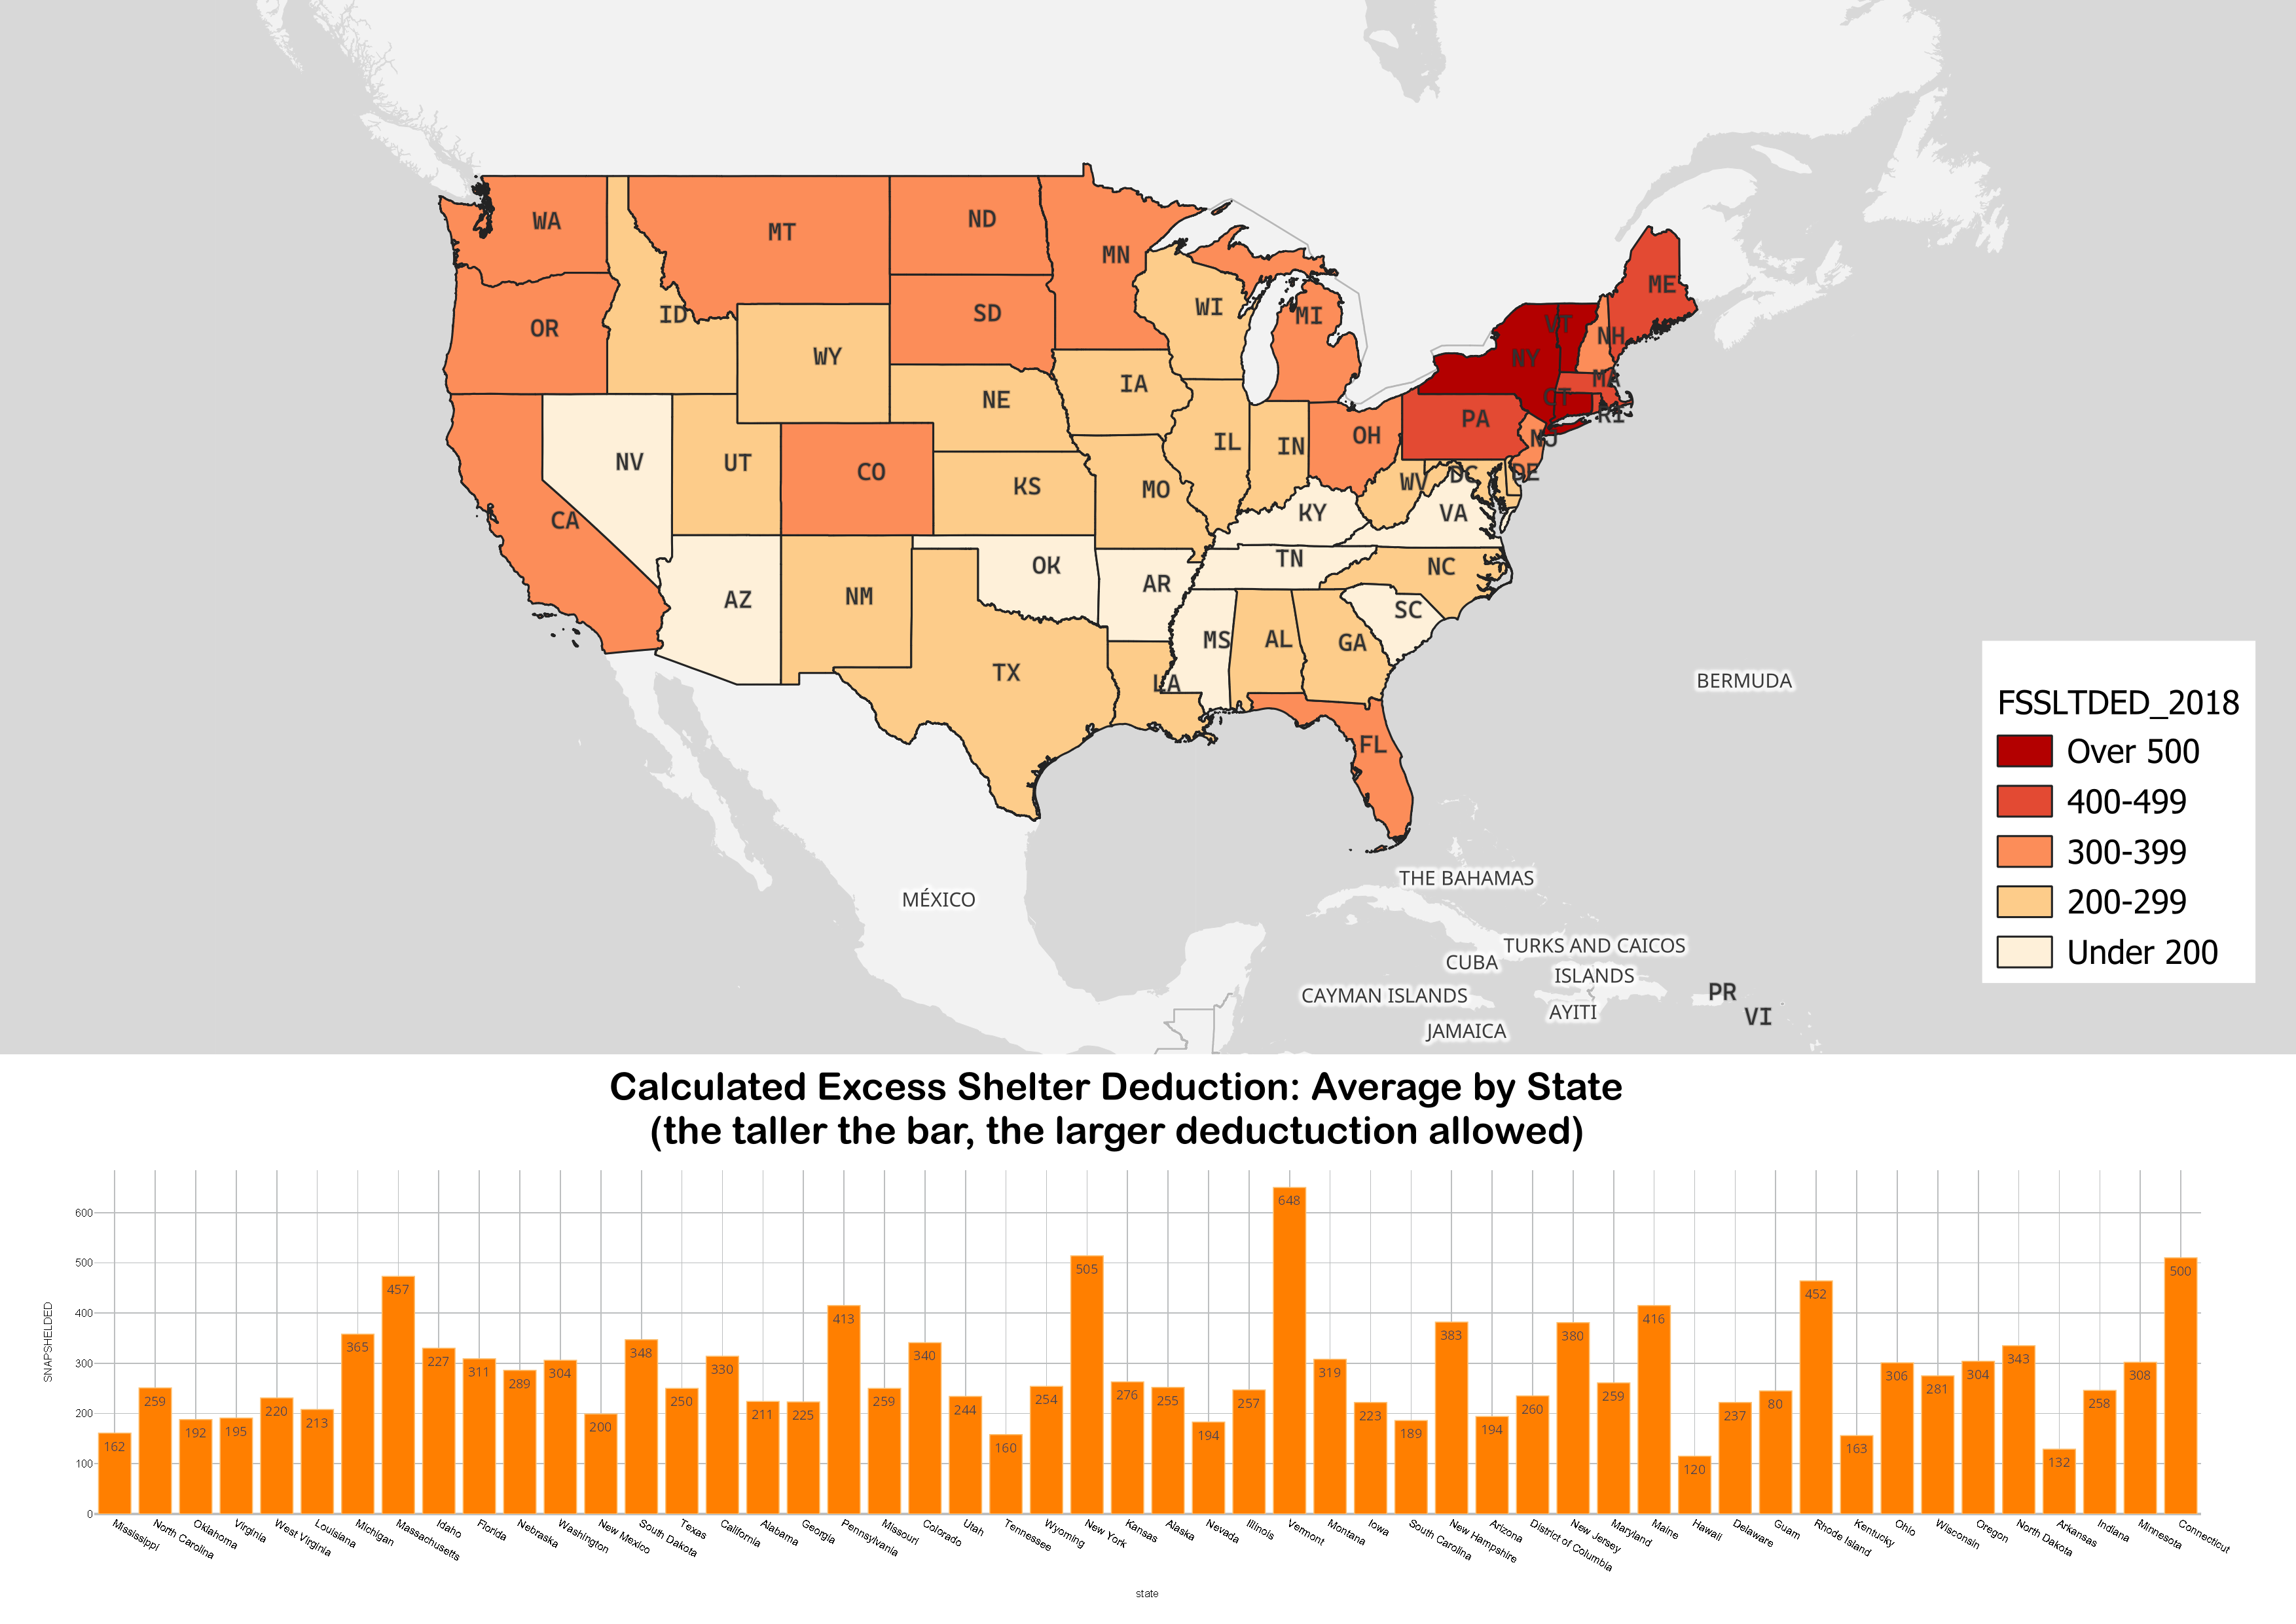
- The top 4 predictors were all related to shelter and housing costs: FSSLTDED, SHELDED, FSTOTDED, and FSSTDDE2
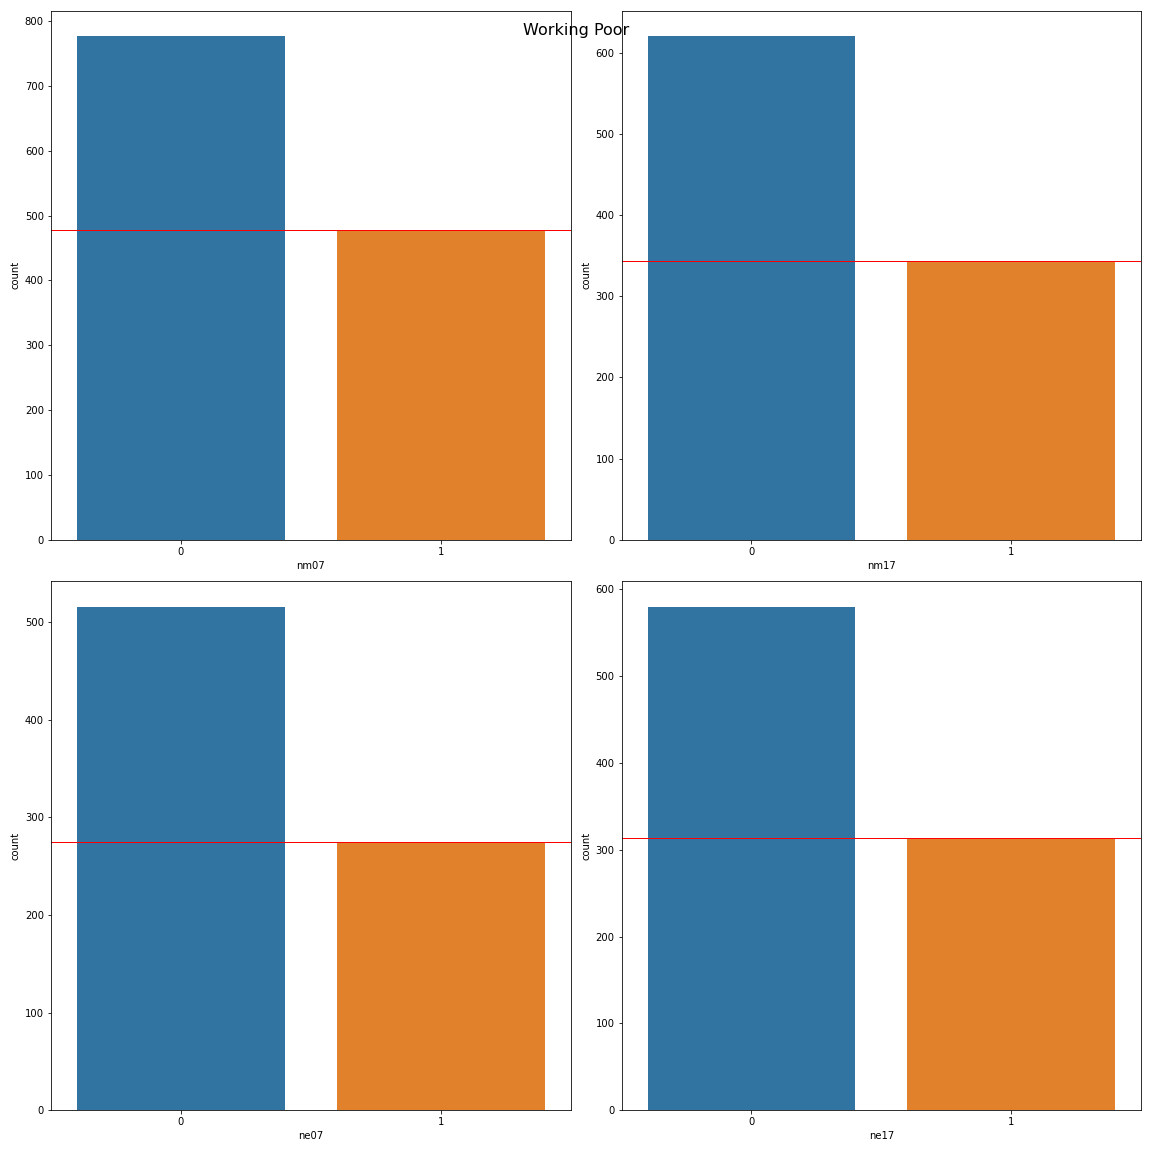
- New Mexico saw ~100 fewer working poor on SNAP in 2017; Nebraska saw ~50 more
- In 2007, SNAP recipients received less assistance from other welfare programs than in 2017
- San Juan County, NM showed greater economic vulnerability than Cherry County, NE across both years
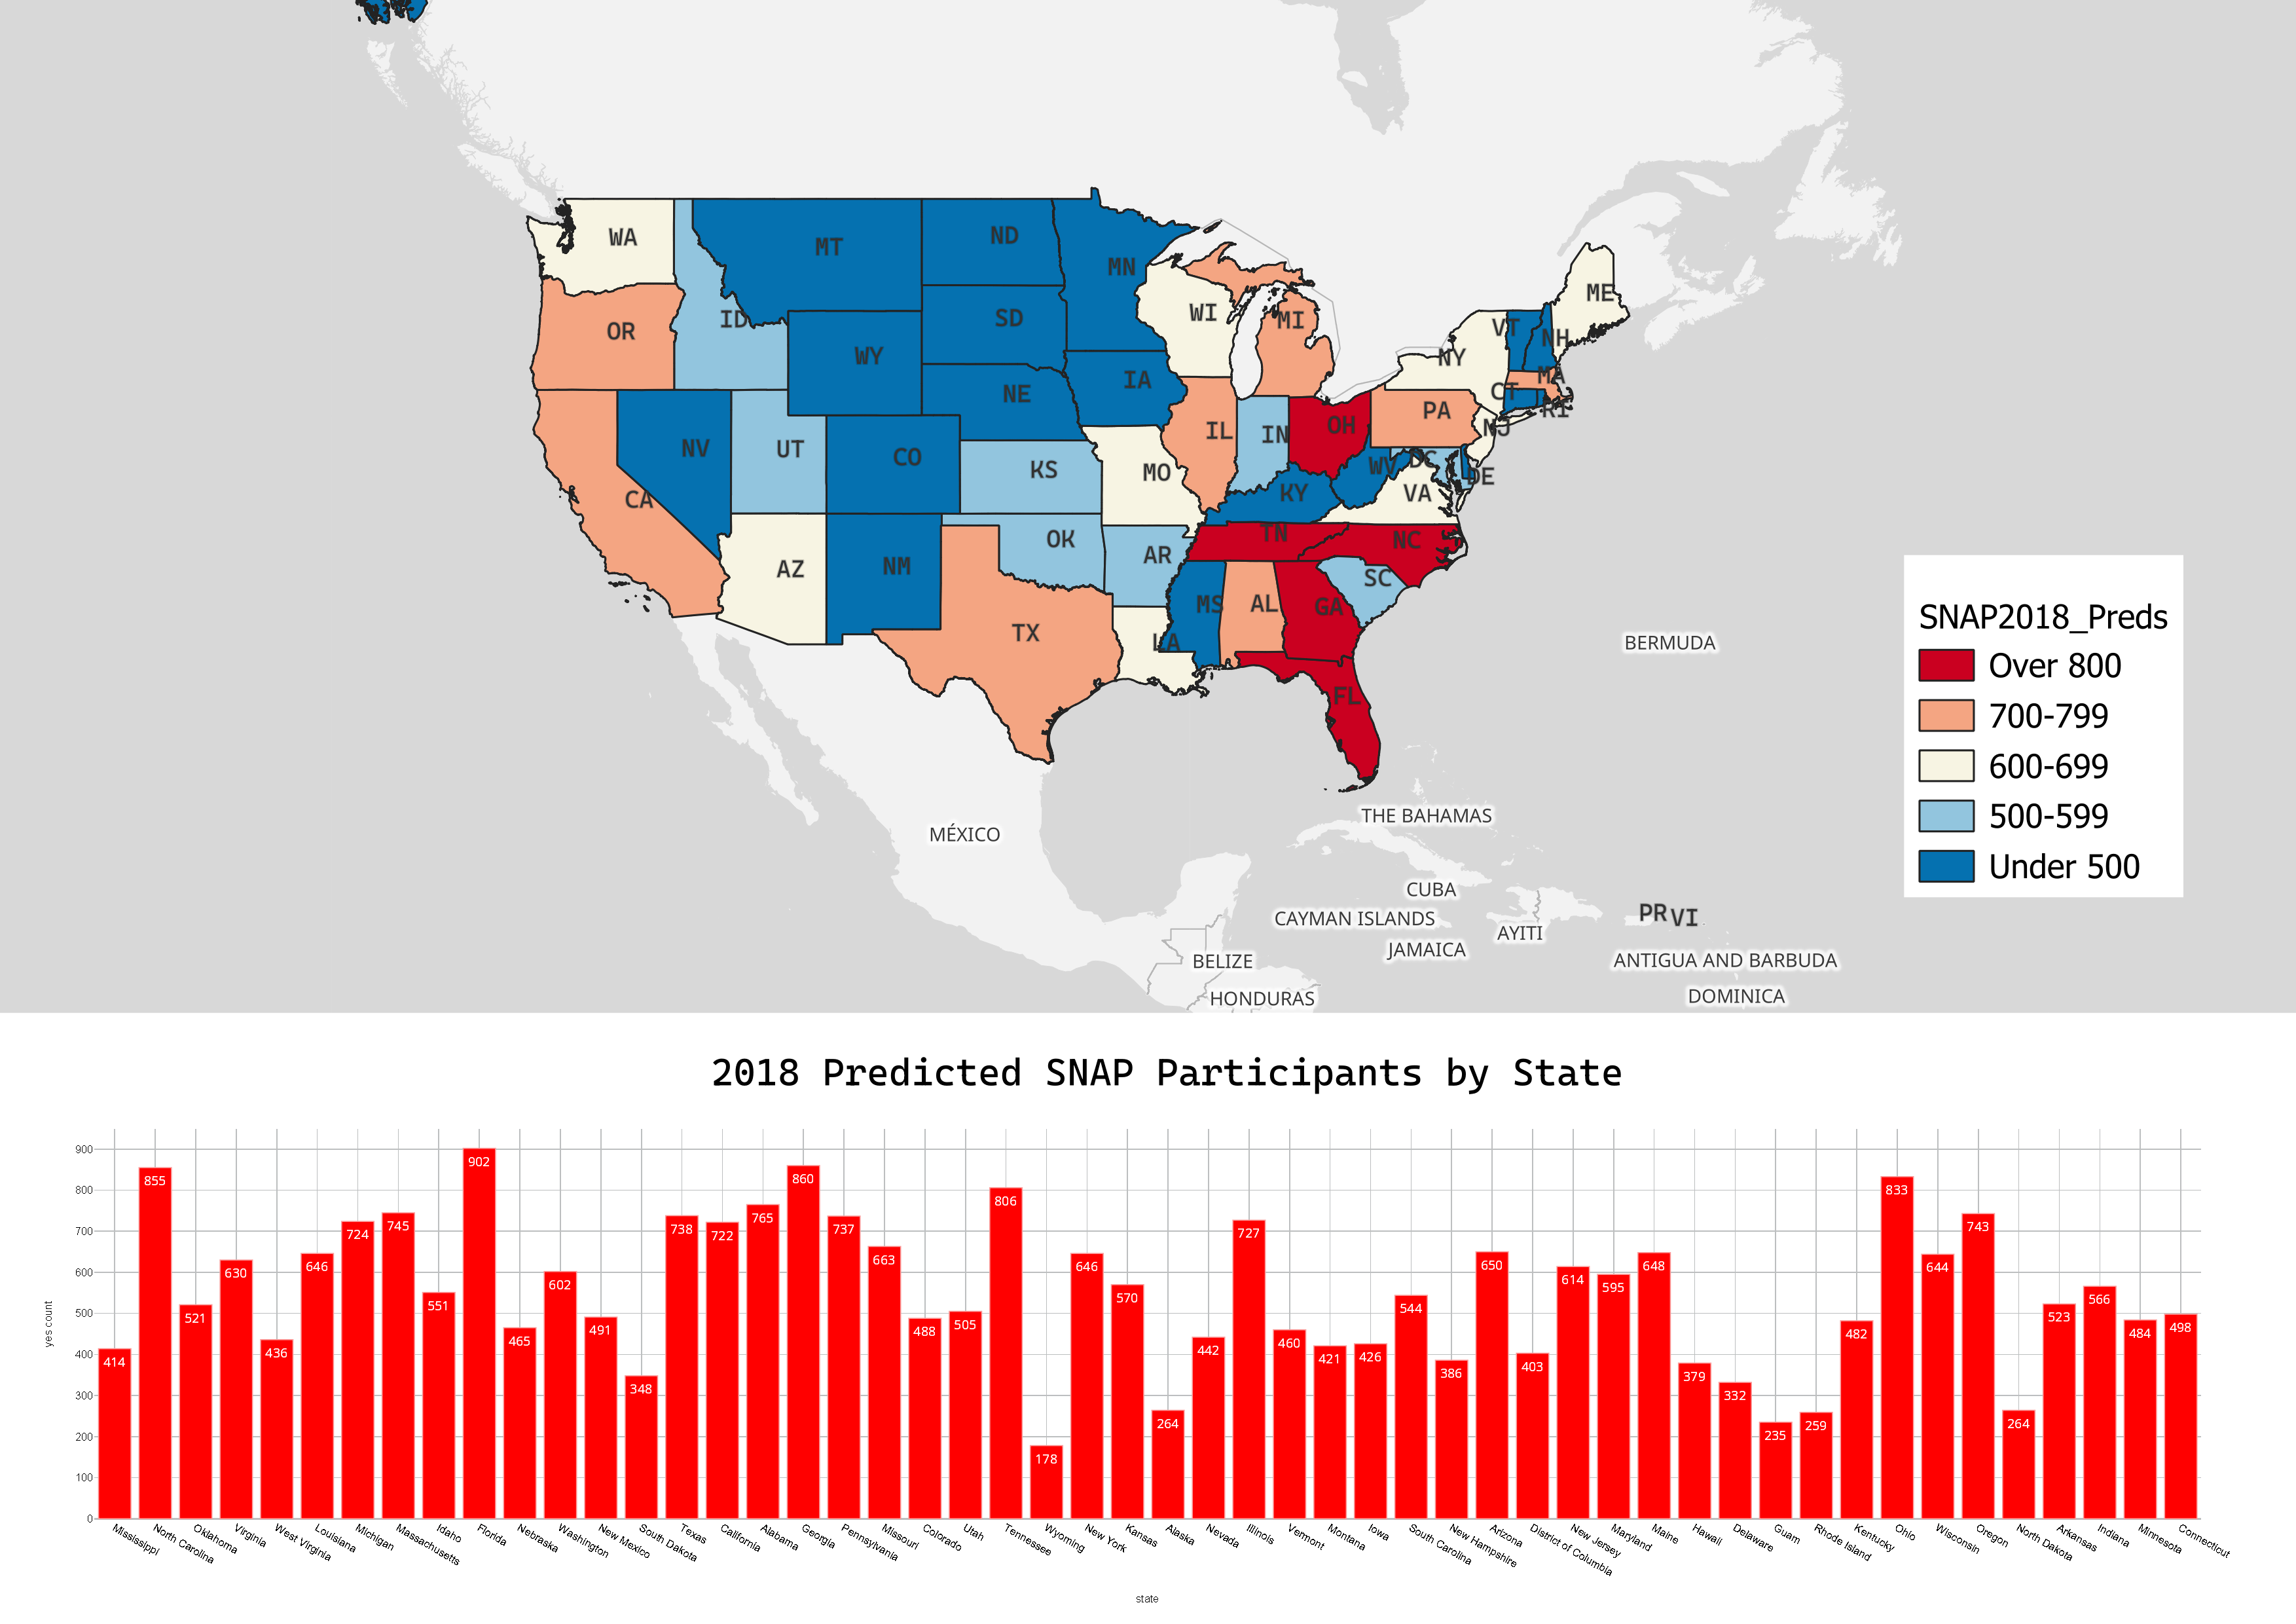
Predicted SNAP Households by State (2018)
The original project identified a next step: building an interactive geographic dashboard to pinpoint high-need areas. The map below realizes that goal — showing all three layers: predicted SNAP households, shelter deductions, and self-employment deductions, visualized at the state level for 2018.
↑ Hover over a state to see values. Toggle layers using the control in the top left. Layers were created in QGIS, exported to GeoJSON, and displayed here using Leaflet.